EXPERT INSIGHT
Study: Early Experiments and Applications for Real-Time Control with Materialise Control Platform and Sigma Labs Melt Pool Monitoring
The Materialise Control Platform delivers an industry-first ability to identify and address process and quality issues in real time.
Metal additive manufacturing (AM) has become a prominent piece of the manufacturing toolkit for industries such as aerospace, medical devices, automotive, and energy to introduce more localized, customizable production. However, a lack of process robustness and repeatability is holding back the broader adoption of AM for serial production. The need for post-build inspection and quality assurance can result in increased costs compared to conventional manufacturing methods.
The Materialise Control Platform (MCP) is an embedded hardware solution that gives end-users more control over the AM process. By integrating the MCP with Sigma Labs’ PrintRite3D® sensor technology, we can identify quality issues and intervene to correct them in real time. Such control actions improve productivity and reduce scrap rates, paving the way for manufacturers to advance their operations and implement metal AM in serial production. The MCP is mostly implemented by AM machine manufacturers when designing their machines, but it can also be retrofitted as an add-on to existing 3D printers in the field.
Other benefits of integrating MCP and PrintRite3D® include reduced hardware footprint — up to a 70% hardware cost reduction — much cleaner high-resolution data in smaller data files — up to a 90% file size reduction — and an open, integrated system with a freely programmable toolbox for user-specific closed-loop algorithm development for your own IP.
The solutions in action
Introduction
This section will dive into a specific experiment we completed — the main component of which is our unique experimental set-up. The set-up consists of an SLM Solutions 125HL machine retrofitted with the MCP and equipped with a Sigma Labs PrintRite3D® system.
The introduction of the MCP into the machine allows users to have full control over the printing process and change printing parameters on even the smallest scale — sections of scanning vectors, for example. This permitted us to perform our experiment by inducing only very local errors.
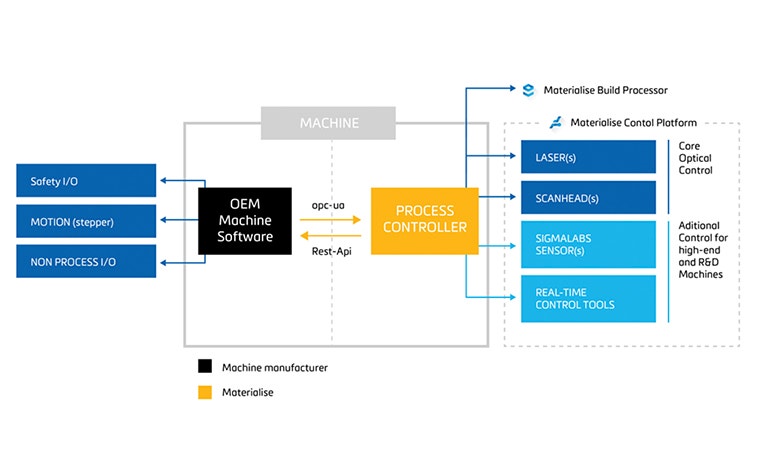
With the tight integration between the Sigma Labs PrintRite3D® system and the MCP, the MCP serves as the data acquisition system for the Sigma Labs system by connecting directly to the measuring diodes. These diodes provide the MCP with in-process access to the ongoing melt pool measurements by the Sigma Labs system.
Thanks to a newly developed quality-in-the-loop (QiL) module on the MCP, users can now implement closed-loop control algorithms. For the remainder of this study, we will focus on closed-loop control using the thermal energy density (TED) metric, which correlates very well with input energy density and, consequently, with part density.
The experiment
For the experiment, we printed a cylindrical geometry in which we introduced a series of errors that were optimized to easily visualized by CT evaluation. We generated the errors by deliberately and locally modifying the laser power to invoke a change in the input energy density. We induced the errors using the following method: after printing a series of layers at nominal laser power, we started changing the laser power of the hatching vectors every five layers. First, we changed all hatch vectors, then consequently changed 20, 15,10,7,5,3,2,1 for each of the five subsequent layers. After these changes, we returned to nominal values. This error sequence was repeated twice. First, we reduced the power from the nominal 100W down to 40W, effectively reducing the energy density to 40%. Afterwards we repeated the same sequence, reducing the power to 50W.
Since we knew that each layer had a thickness of 30um and, with nominal parameters, there was a significant remelting of the previous layer, pores induced by errors would tend to get fixed in the next layer if it was scanned with nominal parameters. Therefore, we designed the experiment to repeat errors for multiple layers, rotating the pattern for every layer. This led to overlapping error regions, which changed in size according to the size of the error. Therefore, we expected to find a cone-like effect inside the cylindrical sample, even with remelting considered.
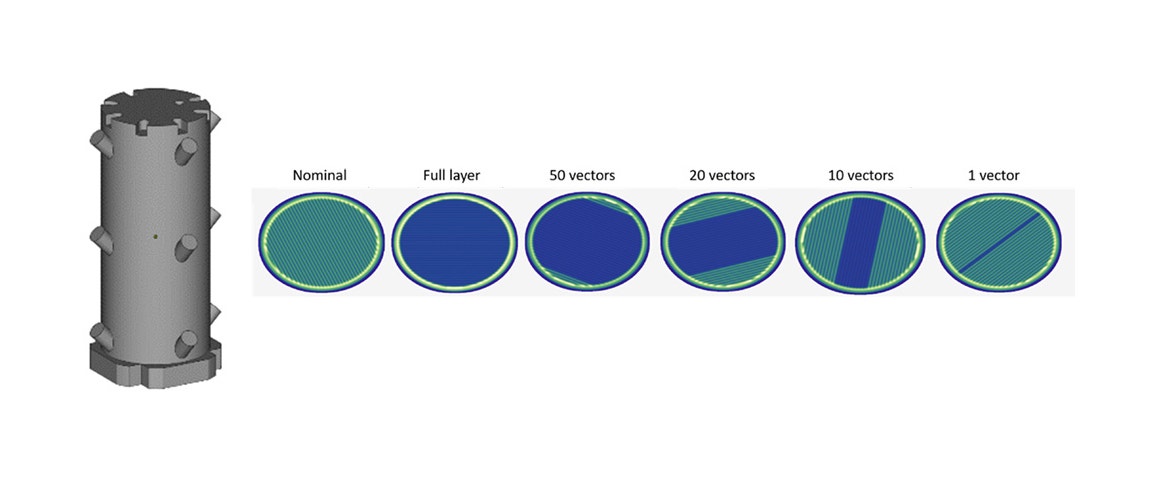
Fig 2: Left: Impression of the STL of the produced artifact. Right: Materialise Inspector’s energy density map visualization of a subset of layers with induced errors. The green areas represent the nominal energy density while blue represents areas of lowered energy density.
The research question was: if we build the cylindrical geometries with the errors in laser power, can we measure porosities in the samples (using CT scanning), and are we able to get rid of the these porosities by using closed-loop control based on the TED metric?
To answer these questions, we built the cylindrical samples twice: first as a reference build — not using closed-loop control with the errors as described above — and the second time using closed-loop control. The closed-loop control experiment was our attempt to filter out the induced defects. It’s possible to directly compare the two tests based on the actual input of power density, the melt pool monitoring signals analyzed with the Sigma Labs data, and by using CT data, the latter considered the ground truth.
Results without closed-loop control
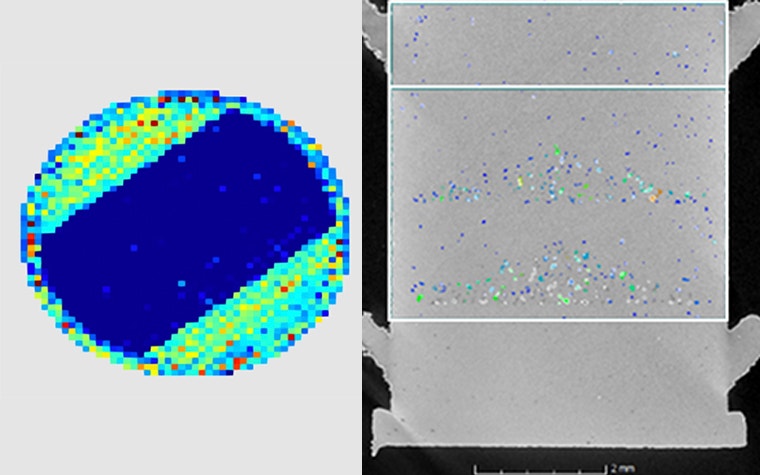
Let’s first look at the experiment without closed-loop control. In this experiment, you would expect two zones with reduced energy density, as described before. These zones were clearly identifiable in the input data to the machine, as shown in figure 2. When we investigated the log and Sigma Labs’ data of the layers with defects in those areas, they clearly showed the expected behavior from a melt pool measurement point of view. To illustrate, let’s look at layer 105, a layer in which the laser power was reduced to 40W for ten vectors around the center of the cylinder. In the left image of Figure 3, you can see a plot of the measured energy density by the Sigma Labs system (TED).
We also took CT scans of the effects, as shown in the right image of Figure 3. It is apparent that the zones of lower energy density, induced by lowering the laser power, gave rise to zones with a high chance of ‘lack of fusion’ porosity. As expected, these zones have a rather cone-like shape due to the remelting of part of the layers explained in the experimental section.
Results with closed-loop control
Let’s now turn our attention to the experiment that included the closed-loop control. Remember, we used the TED metric because, through its correlation with input energy density, the Sigma Labs system can precisely and repeatably measure energy density. Applying closed-loop control on this TED metric allows us to keep the energy density constant. To do so, we implemented a simple P control loop on the QiL module inside the MCP, including a median filter on the incoming sensor data. This control loop will attempt to keep the energy density at the desired level. For now, the control loop will act on laser power.
Figure 4 shows a side-by-side comparison between the diode measurements from the experiment with no closed-loop control (left image) and the experiment with closed-loop control for two indicative slices taken from each of the respective error zones described in table 1. Since the color axis is fixed for all images, the relative change in induced energy density and its distance to the nominal value is clear from the pictures.
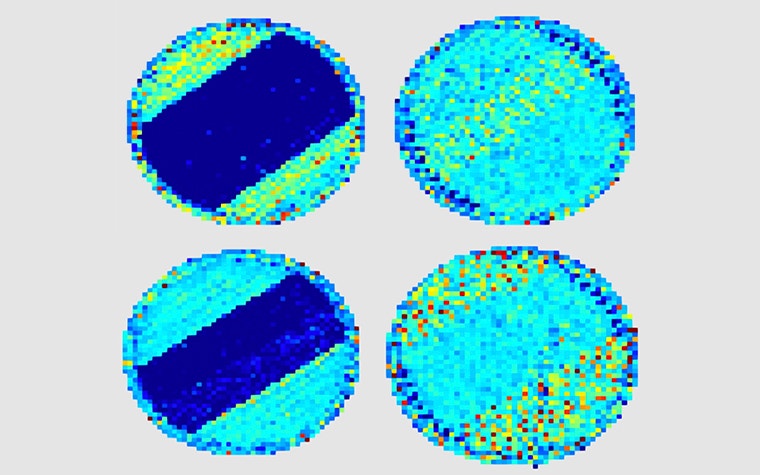
More importantly, all images combined show that, in essence, our closed-loop control strategy works and can steer the system towards the desired energy density for the most parts of the vectors.
We can make additional remarks on the vectors inside the error regions. Even in the controlled images, the onsets of vectors — we use zig-zag scanning so the starting point changes side every other vector — are clearly scanned with lowered energy density compared to the nominal value. The reason for this is clear; we used a median filter prior to the control loop to reduce some of the noise on the diode measurements and to avoid overreacting to the diode signals. The downside is that based on the chosen parameters, the system required a number of samples to “fill” the median filter as well as an additional number of samples to control the energy density to its nominal value.
As we did a CT scan for the reference experiment (fig 5), we also did a second CT scan for the sample produced by the closed-loop control experiment. The conical defect regions introduced in the reference sample due to lack of fusion are not present in the experiment with closed-loop control, showing that, as study of the measured energy density suggest, the control loop reduces the errors.
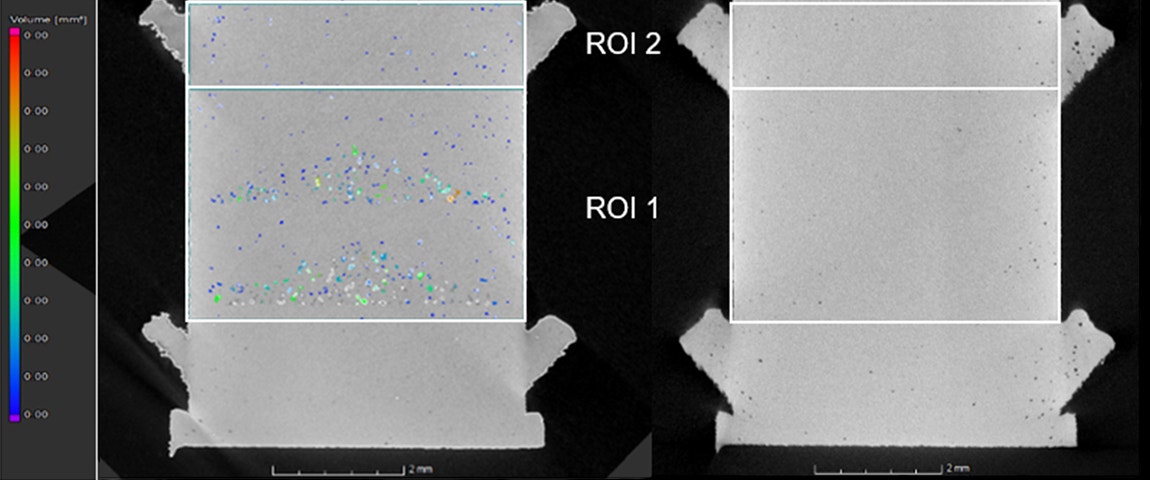
Fig. 5: Left: Vertical cut of the CT scan of the reference object, showing the conical areas with increased porosity, including two zones of interest for porosity calculation. Right: CT scan of the object produced with closed loop control.
Finally, we performed density calculations based on the CT scans of both samples in two regions of interest, see fig 5. Please note that this density calculation was not calibrated. Therefore, only the comparison between the reference and closed-loop samples are relevant.
Table 2 clearly shows that the lack-of-fusion-pores from the reference sample are not present in the closed-loop control sample, as indicated by the Sigma Labs data and seen by comparing the CT scans (see region of interest 1).
Still, the porosity in the region of interest 2 shows a higher figure for the closed-loop controlled sample compared to the reference sample. In fact, the same can be seen in figure 4, where the TED measurements show a higher variability in those zones where the controller didn’t have to compensate. This suggests our current implementation of the P-controller with the noise filter is still too sensitive for noise in the sensor data. We believe that more advanced PID controllers will be able to cope better with this noise and will eventually result in at least the same porosity in the ROI 2.
Conclusion: Possible applications and uses of the platform
(1) EARLY SCRAP IDENTIFICATION AND GUIDANCE FOR POST-BUILD INSPECTION
Using melt pool monitoring will give additional guidance on how to most effectively inspect parts after printing. This holds significant cost reduction opportunities for early scrap identification and optimized post-processing strategies for CT scanning, for example. Post-process quality assurance can represent up to 50% of the total part cost. Hence, any guidance that can reduce this cost is vital for the industrialization of AM.
(2) IN-BUILD CLOSED-LOOP CORRECTION
This is the core of the concept explained in the above experiments. You can complement validated parameter sets for well-known material/machine combinations with in-process, real-time correction based on melt pool data and implemented by the Materialise Control Platform toolbox. This directly reduces scrap rates and improves quality without a disruptive change in the process definition.
(3) OPTIMIZED FOR PRODUCTION
With the open and freely programmable MCP, it is now possible for application companies to develop their own customized print strategies with support of Materialise. This allows them to truly customize the AM process for their specific needs and advance the current state of the AM industry to unseen levels of quality and productivity.
So, point proven, right? What’s next?
Well, yes and no! Yes, this proves that the concept of closed-loop, real-time control by using the MCP and Sigma Labs melt pool monitoring technology has incredible potential, but it is actually just the very first step. Both companies are now reaching out to the wider AM industry to find like-minded experts who want to advance AM processes.
In addition to the platform itself, Materialise and Sigma Labs will collaborate with end-users and machine manufacturers through a validation partner program to refine processes for their unique applications. Both companies are looking for partners across industries willing to expand their use of metal AM in serial production.
About Materialise
Materialise incorporates over 30 years of 3D printing experience into a range of software solutions and 3D printing services, which form the backbone of the 3D printing industry. Materialise’s open and flexible solutions enable players in a wide variety of industries, including healthcare, automotive, aerospace, art and design, and consumer goods, to build innovative 3D printing applications that aim to make the world a better and healthier place. Headquartered in Belgium, with branches worldwide, Materialise combines the largest groups of software developers in the industry with one of the largest and most complete 3D printing facilities in the world.
About Sigma Labs
Sigma Labs Inc. is a leading provider of in-process quality assurance (IPQA™) software to the additive manufacturing industry. Sigma Labs specializes in the development and commercialization of real-time monitoring and analytics solutions known as PrintRite3D® for 3D metal and polymer advanced manufacturing technologies. PrintRite3D® detects and classifies defects and anomalies in real-time during the manufacturing process, enabling significant cost-savings and production efficiencies. Sigma Labs believes its software product will be a major catalyst for the acceleration and adoption of industrial 3D printing. For more information, please visit www.sigmalabsinc.com.
Share on:
You might also like
Never miss a story like this. Get curated content delivered straight to your inbox.